
Software Performance Testing: Definition, Best Practices, Tools, Stress & Load Tests

 15 MIN
 09 Sep 2025
Performance testing is a cornerstone of quality assurance for any application. A well-executed software performance test ensures your app not only functions, but performs smoothly in real-world scenarios. If you’re wondering about performance testing meaning, it’s all about evaluating how fast, stable, and scalable your software is under different conditions.
Table of content
No matter if you are a junior tester, career switcher, or beginner in QA, knowledge of performance testing will allow you to test performance effectively and build more stable software.
What is performance testing?
Performance testing is a type of non-functional testing that focuses on how your application behaves under various conditions — from normal usage to extreme load. Speed, responsiveness, stability, and scalability are the key attributes under the spotlight. While functional testing checks what your software does, performance testing is all about how well it does it.
At its core, performance testing evaluates important quality attributes of your system in action. You simulate real-world user activity to see how your software holds up under different conditions – whether it’s a normal workload or extreme traffic spikes. You’re looking for answers to questions like:
- How fast does the system respond to user actions?
- How many operations or transactions can it handle per second (throughput)?
- How efficiently does it use system resources like CPU, memory, and network bandwidth?
But it goes deeper than just metrics. Performance testing helps reveal how your system recovers from stress, and whether it remains stable and usable even when stress testing pushes the system beyond its limits. It’s your safety net, your early warning system, and your confidence booster – all rolled into one.
Why do you need performance testing?
Because even a flawless app will frustrate users if it’s slow or crashes under load. And let’s face it: today’s users have high expectations and little patience.
A sluggish app isn’t just annoying – it can cost you money, users, and reputation. Consider this:
- Amazon discovered that just a 100-millisecond delay in response time led to a 1% drop in sales.
- Google observed that an extra 0.5 seconds in loading time cut their search traffic by 20% (Source: gigaspaces.com).
These stats aren’t just numbers – they’re real-world proof that performance impacts business. Slow websites and applications get abandoned. Poor performance damages brand trust. And downtime can cause real financial loss.
Without performance testing, you risk launching a system that crashes under real user loads or becomes unresponsive during traffic peaks. You might not even notice the performance bottlenecks – until your users do. And by then, it’s often too late.
The value performance tests brings
By incorporating performance testing into your software development life cycle, you:
- Help identify performance bottlenecks before they hit production.
- Ensure your system is scalable as user numbers grow.
- Validate that your application can recover gracefully from stress conditions.
- Deliver a reliable and responsive experience to users, even during peak times.
In short, performance testing will help you build software that doesn’t just work – it works well under pressure. It’s about making sure your app isn’t just functional, but also fast, stable, and ready for the real world.
Different types of performance testing
Not all performance tests are created equal. Depending on what aspect of system behavior you want to examine — normal load, overload, long-term performance, sudden spikes, or massive data volumes — you’ll need to choose the right type of test.
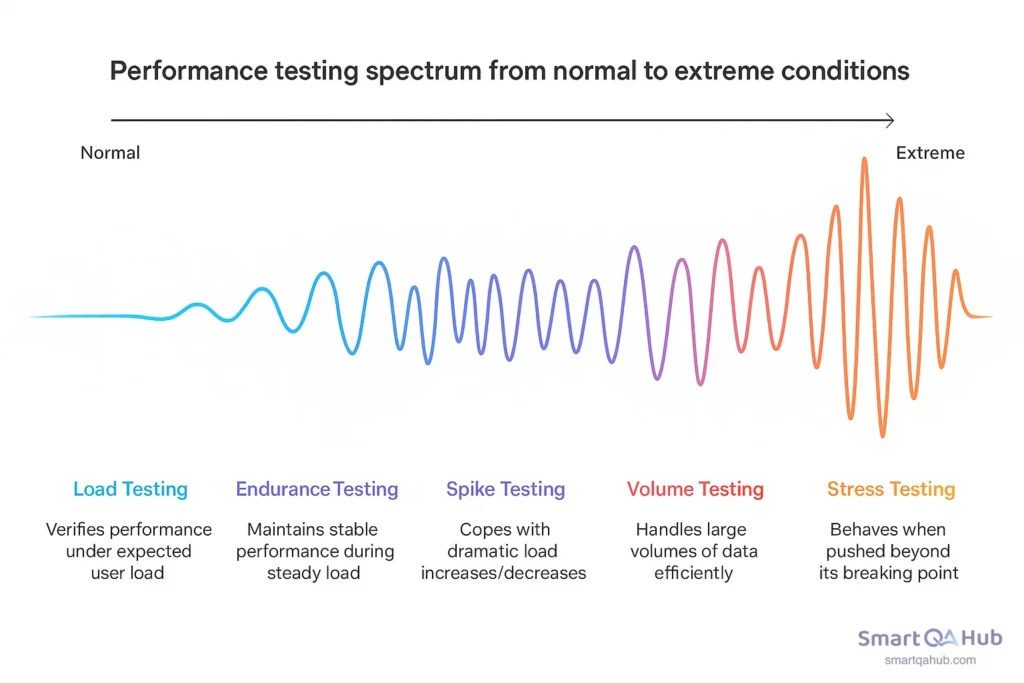
1. Load testing
Purpose: To verify system performance under normal, expected user load — the kind of traffic you expect daily.
Example: If your website normally serves around 1,000 concurrent users, a load test simulates that exact number (maybe with a slight buffer) to check that everything still runs smoothly: response times, stability, and throughput.
Why it matters: Even under “normal” conditions, things can go wrong — slow queries, limited thread pools, underpowered servers. Load testing helps you catch these bottlenecks before your users do.
Quick tip: Treat load testing like a dress rehearsal — test before every big release, and simulate peak daily hours, not just average usage.
2. Stress testing
Purpose: To see how your system behaves when pushed beyond its capacity — until it breaks.
Example: You gradually increase load from 1,000 to 5,000 or even 10,000 users, watching how the system performs, when errors start spiking, or when it crashes altogether.
Why it matters: This test shows your app’s breaking point, how it fails (gracefully or catastrophically), and how well it recovers once the stress is reduced.
Pro tip: Don’t just focus on CPU and memory — stress testing can uncover issues like exhausted thread pools, hitting API rate limits, or hidden bottlenecks in your infrastructure.
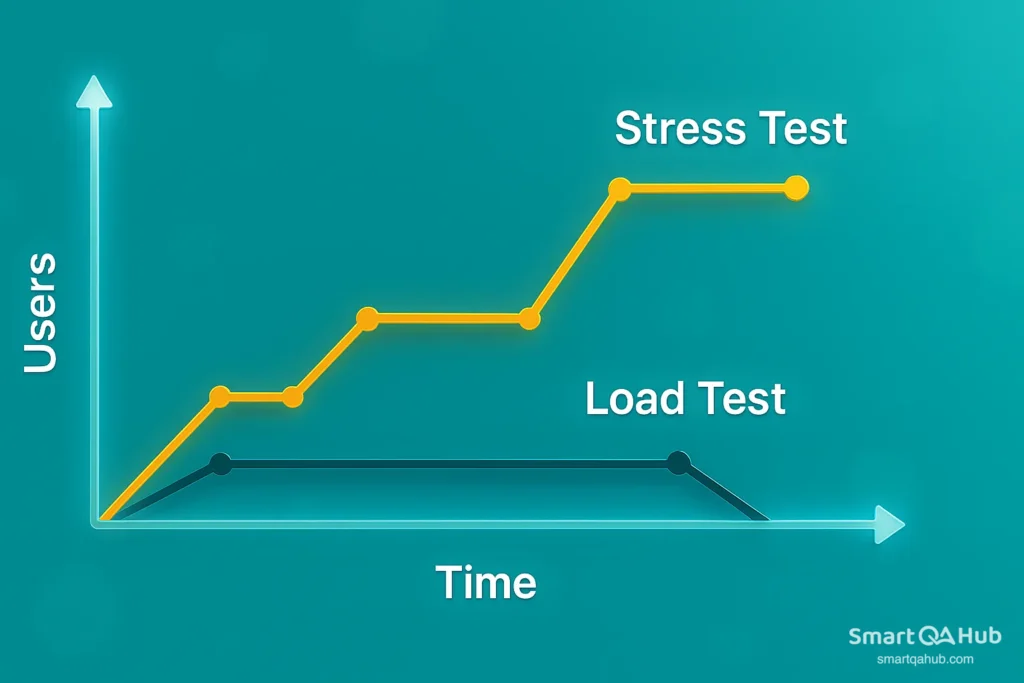
Load vs stress testing
When testing overall performance, both load and stress testing push your system — but how and why they push it is very different.
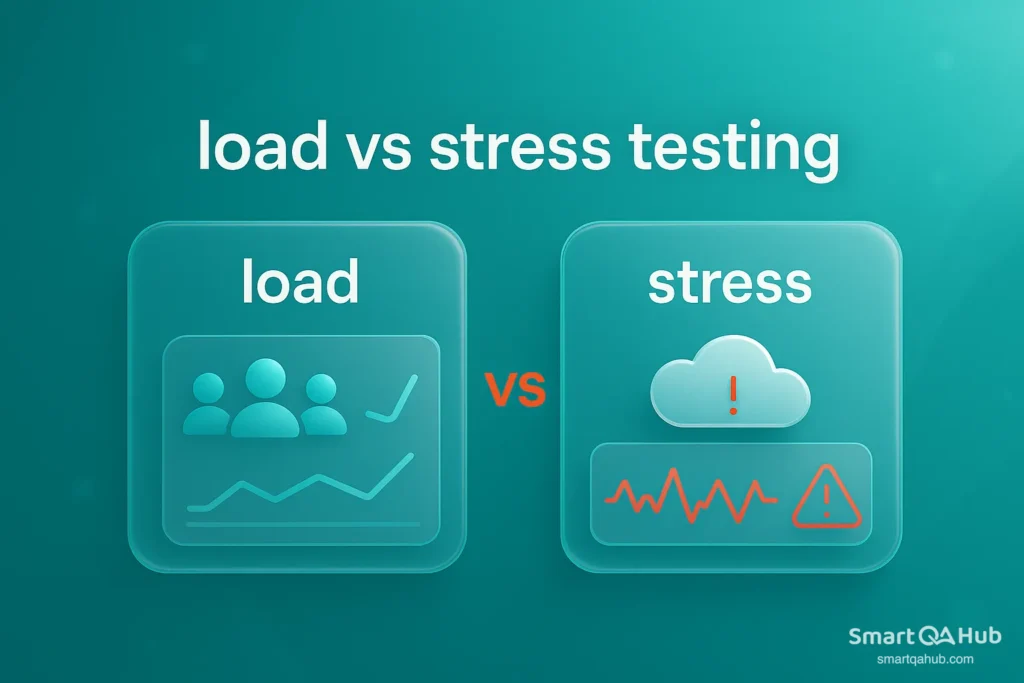
Load testing focuses on realism. It simulates typical user load — sometimes a bit higher — to check if your app can handle what it’s expected to face in production. Stress testing, in contrast, is about extremes. It throws unrealistic, excessive load at your system to see what breaks, where it breaks, and how gracefully it fails.
Load testing answers: Can we handle what’s coming?
Stress testing asks: What happens when it’s way too much?
Both are crucial — but they serve very different purposes in performance strategy.
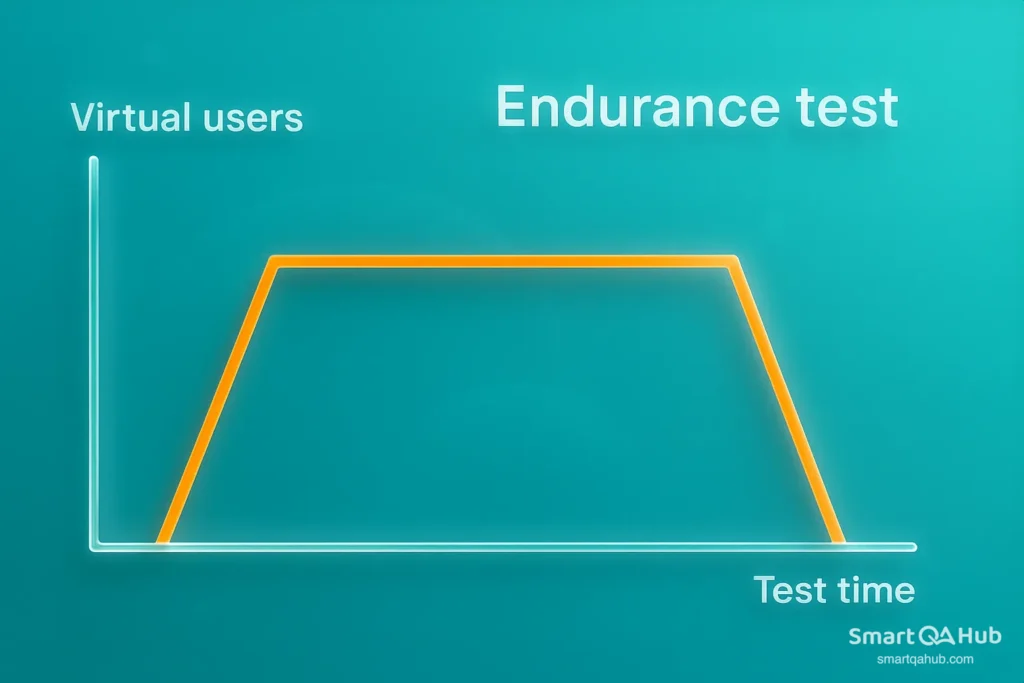
3. Endurance testing (known as soak testing)
Purpose: To verify that your application maintains stable performance during prolonged periods of steady load.
Example: Simulate 500 users continuously for 8–12 hours and observe for slow app performance degradation, memory leaks, or database resource exhaustion.
Why it matters: A system that performs well for 1 hour might degrade after 6. Can your app perform over time, not just in quick tests? That’s what endurance testing reveals.
Watch out for: Subtle issues like unreleased file handles, cache overflows, and growing memory usage are endurance testing red flags.
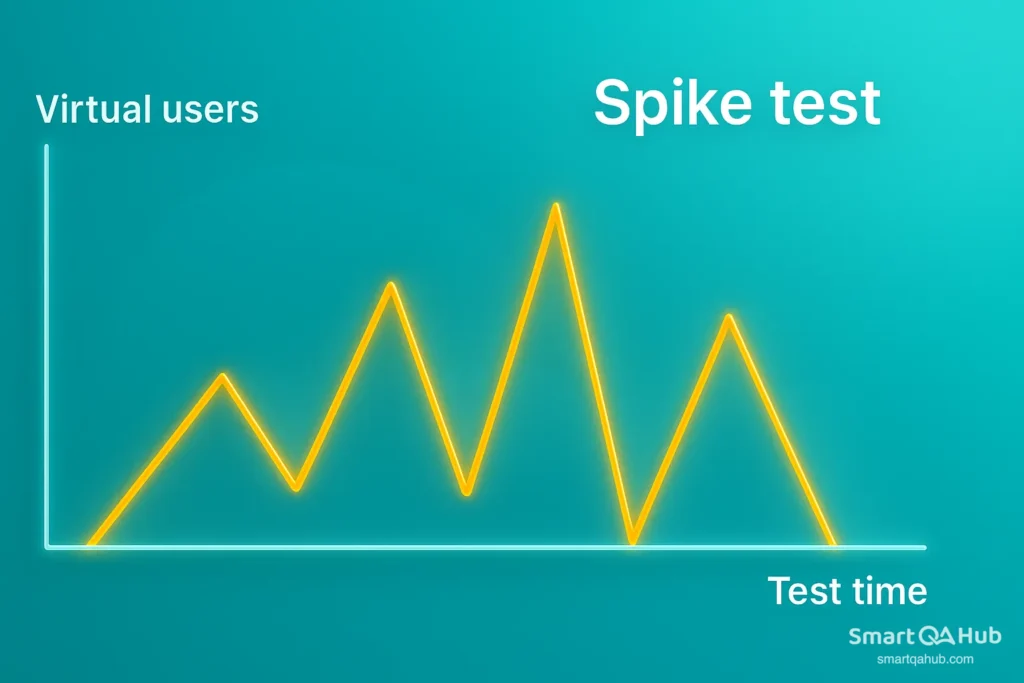
4. Spike testing
Purpose: To check how your system copes with sudden, dramatic increases or decreases in load.
Example: Simulate a surge from 100 to 2,000 users within seconds — then drop back down — and see if the system holds up, slows down, or crashes.
Why it matters: Traffic rarely grows gradually in the real world. Think flash sales, viral tweets, ticket drops, or breaking news. Your system must be ready to flex without falling apart.
Real-world inspiration: E-commerce giants perform spike testing before Black Friday to ensure their checkout flow doesn’t break when thousands click “Buy Now” at once.
5. Volume testing
Purpose: To measure how your system handles large volumes of data, not users.
Example: You might simulate a huge batch job, uploading gigabytes of files or inserting millions of records into a database.
Why it matters: Big data volumes can strain databases, cause memory overflow, or result in timeouts — even if user traffic is low.
Pro tip:
Use volume testing to validate scalability of your backend — APIs, databases, and storage layers should maintain speed even when data sizes explode.
A beginner’s guide to performance testing: From first steps to best practices
So, you’re ready to find out if your app can take the heat? Performance testing isn’t just about launching scripts and watching charts. It’s about designing tests that give you insight — and confidence — that your app can handle the real world.
Quick performance testing tutorial: How to get started
Here’s a step by-step guide to conducting performance testing the smart way:
Step 1: Define clear goals
Start with one question: What do we want to learn? Don’t test blindly — know what you’re measuring. Some common goals:
- Can the system handle 1,000 users without slowing down?
- Does response time stay under 2 seconds during peak traffic?
- What’s the maximum number of concurrent users before failure?
Define pass/fail criteria — e.g., “95% of transactions under 1 second” or “No more than 2% error rate.”
Pro tip: Tie your goals to business needs — it’s not just about numbers, it’s about user experience.
Step 2: Identify key scenarios
You can’t test everything — so test what matters most:
- Most-used user flows (login, checkout, search)
- Critical backend services (APIs, database queries)
- Peak traffic use cases (e.g., Black Friday load)
These will become the scripts in your test tool.
Step 3: Set up the test environment
Your results are only as good as your environment. Try to replicate production as closely as possible:
- Similar hardware, network, and database setup
- Realistic data volumes
- Logging and monitoring enabled
Avoid software testing on dev laptops — or your numbers won’t mean much.
Pro tip: Use cloud-based environments if you need to scale or test distributed systems.
Step 4: Script the test
Use a performance testing tool (like JMeter, Gatling, or Locust) to create test scripts that simulate user behavior. This includes:
- Defining user actions (clicks, form submissions, API calls)
- Adding think times (delays between actions to mimic real usage)
- Configuring test data (e.g., login credentials or search terms)
Step 5: Dry run
Before the big test, run a lightweight version to validate everything:
- Do scripts behave as expected?
- Any broken links, auth issues, or missing data?
- Is monitoring active?
Fix early mistakes before the full load hits.
Step 6: Execute the test
Now it’s showtime. Launch your test with the defined number of virtual users over the target duration. Common load patterns:
- Steady load – to simulate average traffic
- Ramp-up load – to test gradual increase (e.g., 100 to 1,000 users)
- Spike load – to simulate sudden surges (like product launches)
Pro tip: Record key metrics like response time, error rate, throughput, and resource usage (CPU, memory, DB, network).
Step 7: Analyze the results
Once the test finishes, the real work begins:
- Did the system meet performance goals?
- Where were the bottlenecks — slow queries, overloaded servers, memory leaks?
- Were any thresholds exceeded?
Look for patterns, not just spikes. Check things like:
- At what user count does performance degrade?
- Does response time grow linearly or suddenly spike?
- Any error trends (timeouts, 5xx codes, failed logins)?
Step 8: Optimize and retest
Performance testing isn’t one-and-done.
- Tune queries
- Scale infrastructure
- Optimize code paths
- Fix memory leaks
Then test again — using the same performance test scenarios — and compare results. This is how you measure improvement or catch regressions.
Pro tip: Save test results as benchmarks. Over time, these become your performance history.
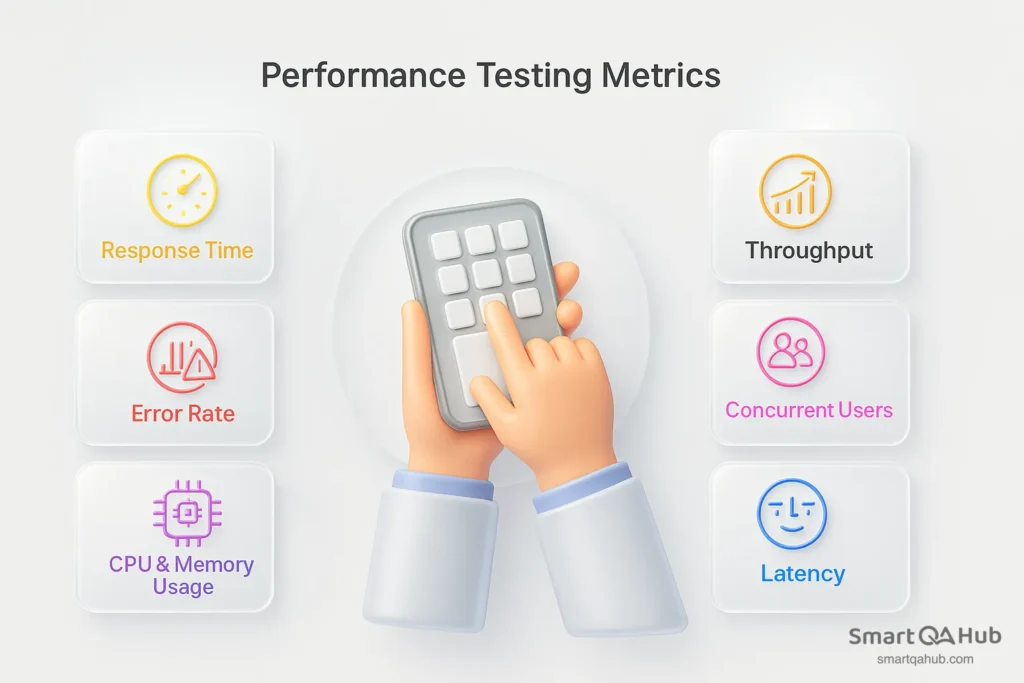
Key software performance metrics to monitor
When you conduct performance testing, focus on:
- Response time shows how quickly your system reacts to user actions. It’s the time from sending a request to receiving a full response. If users wait more than 2–3 seconds, they’re likely to leave — so keep this number low.
- Throughput measures how much your system can handle, typically in requests or transactions per second. It reflects how efficiently your app performs under load and whether it scales well as traffic increases.
- Error rate tells you how many requests fail during the test — from timeouts to server errors. A rising error rate under stress is a clear sign your app is struggling and needs attention.
- Concurrent users represent how many people your system supports at once. This helps you find the tipping point — when performance begins to degrade due to too many users.
- CPU & memory usage reveals how your system resources hold up under pressure. Maxed-out CPU or steadily increasing memory often point to bottlenecks or memory leaks.
- Latency measures the time from a user request to the first byte of the response. Even with a decent response time, high latency can make your app feel slow — especially in APIs or real-time apps.
Performance testing tools
You’ve got your performance test plan ready — now you need the right performance test software to bring it to life. These tools help simulate user load, track system behavior, and give you insights that matter. Let’s explore the most popular performance testing tools:
1. Apache JMeter
Best for: Broad use cases, web apps, API testing, large test scenarios
Why people love it:
- Open-source and widely adopted
- GUI support for easy test creation
- Can simulate thousands of users
- Huge community and plenty of plugins
- Good integration with CI/CD pipelines
Downside? It can be a bit heavy to set up and manage for very large tests, but with experience, it’s manageable.
2. Locust
Best for: Python developers who prefer coding over clicking
Why people love it:
- Full flexibility writing tests in Python
- Easy to scale across multiple machines
- Great for API testing and complex workflows
If you think in Python, Locust feels natural.
3. Gatling
Best for: High-performance web and API load testing
Why people love it:
- Written in Scala, also supports Java & Kotlin
- High performance with detailed HTML reports
- Ideal for developers who want code-based test definitions
Steeper learning curve if you’re new to Scala, but powerful once mastered.
4. Artillery
Best for: Node.js teams, quick API testing
Why people love it:
- Simple YAML configs or JS scripts
- Fast setup with minimal boilerplate
- Easy to run locally or in CI
A great balance of simplicity and power for smaller projects or fast feedback.
5. BlazeMeter (based on JMeter)
Best for: Enterprises and teams needing large-scale cloud testing
Why people love it:
- No infrastructure management required
- Supports JMeter, Gatling, Selenium, and more
- Detailed dashboards and team collaboration features
Free tier is limited — built more for teams with budgets.
6. Flood.io
Best for: Teams needing scalable, on-demand cloud testing
Why people love it:
- Supports multiple test engines (JMeter, Gatling, etc.)
- Intuitive UI and test orchestration
- Instant access to global test locations
Excellent for running performance tests without building your own infrastructure.
So, which tool should you choose?
| Your situation | Tool suggestion |
|---|---|
| Just starting, want easy scripting | JMeter or Artillery |
| You love Python | Locust |
| Testing APIs at scale | Gatling, JMeter, or Flood.io |
| Want zero infrastructure hassle | BlazeMeter or Flood.io |
| Want full code control | JMeter, Locust, or Gatling |
| Hate coding? | Try GUI-based tools like BlazeMeter |
Best practices for software performance testing
To get the most from your performance tests, follow these performance testing best practices.
1. Define clear performance goals
Know what performance metrics matter (response time, CPU usage, throughput). Not sure what throughput in performance testing means? It’s the amount of data your application can handle within a specific time frame, helping you measure how well your system can manage load during a test.
2. Test early, test often
Performance problems are harder (and costlier) to fix late. Start testing in early stages — even on smaller components — and integrate performance checks into CI/CD pipelines.
3. Simulate realistic load patterns
Use real-world data and user behavior patterns. Avoid artificial test scenarios that don’t reflect how users actually interact with your system.
4. Isolate performance bottlenecks
Monitor metrics like CPU, memory, I/O, database queries, and network latency. A good test doesn’t just show that something is slow — it helps you find why.
5. Automate where possible
Automate repetitive performance tests to run with every build. Tools like JMeter, Gatling, or k6 can be part of your test pipeline.
6. Test in a production-like environment
The closer your test setup is to production, the more accurate your results. Use the same configurations, hardware, databases, and network setups.
7. Don’t ignore the backend
Test APIs, database performance, cache usage, and background services. Frontend performance matters, but backend is where most bottlenecks hide.
8. Measure, then optimize
Always collect performance metrics before making optimizations. Don’t guess — let the data lead you.
9. Document and share results
Keep logs, charts, and reports. Share insights with devs, ops, and product teams. Performance is a shared responsibility.
Tip for Java performance testing: If you’re working with Java-based systems, it’s essential to tailor your performance scenarios to the JVM environment. Profilers like VisualVM or JFR (Java Flight Recorder) can help with deep-dive analysis during your java performance testing.
These best practices for performance testing ensure meaningful insights and reliable test outcomes.
FAQ: Common questions about performance testing process
What is the meaning of performance testing?
Performance testing meaning is simply evaluating how well your software performs under different conditions, such as normal usage or heavy traffic, to find bottlenecks and ensure your application stays fast, stable, and scalable.
How long does system performance testing take?
The duration of performance testing depends on the complexity of your application and the types of tests you run. A basic load test may take a few hours, while comprehensive performance testing, including analysis, can take several days to complete effectively.
What tools are used for performance testing?
Common tools used for performance testing include JMeter, LoadRunner, and Gatling, which help simulate user traffic, automate tests, and analyze results to identify bottlenecks in your application.
What is the difference between load testing and stress testing?
Load testing measures how your application performs under expected load (user traffic), while stress testing checks how the system behaves under extreme or unexpected loads to find breaking points and recovery capabilities.
Can performance testing be automated?
Yes, it can be automated using tools like JMeter or LoadRunner. Automation helps simulate user load consistently, speeds up the testing process, and enables regular performance checks during development.
When is the best time to conduct performance testing?
The best time to conduct performance testing is as early as possible in your development cycle and regularly throughout your software’s lifecycle. Early testing helps you catch performance issues before they impact users and allows you to optimize your system under various loads.
What performance test types should I use?
The type you use depends on your goals. Load testing checks behavior under expected traffic, stress testing examines performance under extreme conditions, and endurance testing ensures stability over time. Using the right type helps you identify specific bottlenecks in your application.
Why is choosing the right performance testing tool important?
Selecting the right tool for performance testing is essential because it allows you to simulate real-world scenarios accurately, automate tests, and analyze detailed results. The right tool helps streamline your performance testing process and ensures you get actionable insights to improve your application’s speed and stability.
What are the benefits of performance testing?
The benefits of performance testing include ensuring your application is fast and stable under load, identifying bottlenecks before users are impacted, improving scalability, and providing a better user experience even during peak traffic.
Ready to test with confidence?
Performance testing is key to building stable, fast, and reliable software. You’ve now seen what it is, how to use it, and where it fits in real projects. Start small, a simple load test is enough. Then build up, try various test types, and use performance tools like JMeter to grow your skills. Each test you run gets you closer to confidence under load. Even small gains in speed can mean enormous wins for your users and your team. So, pick a tool, test something real, and see what your software can handle. You’ve got this.


